Be the first to know.Before the phone rings.

Network Tool checks every switch, router, server and printer on your company network, reads their logs and traffic, and tells the right person the moment something breaks. It runs on one Linux server that you own.

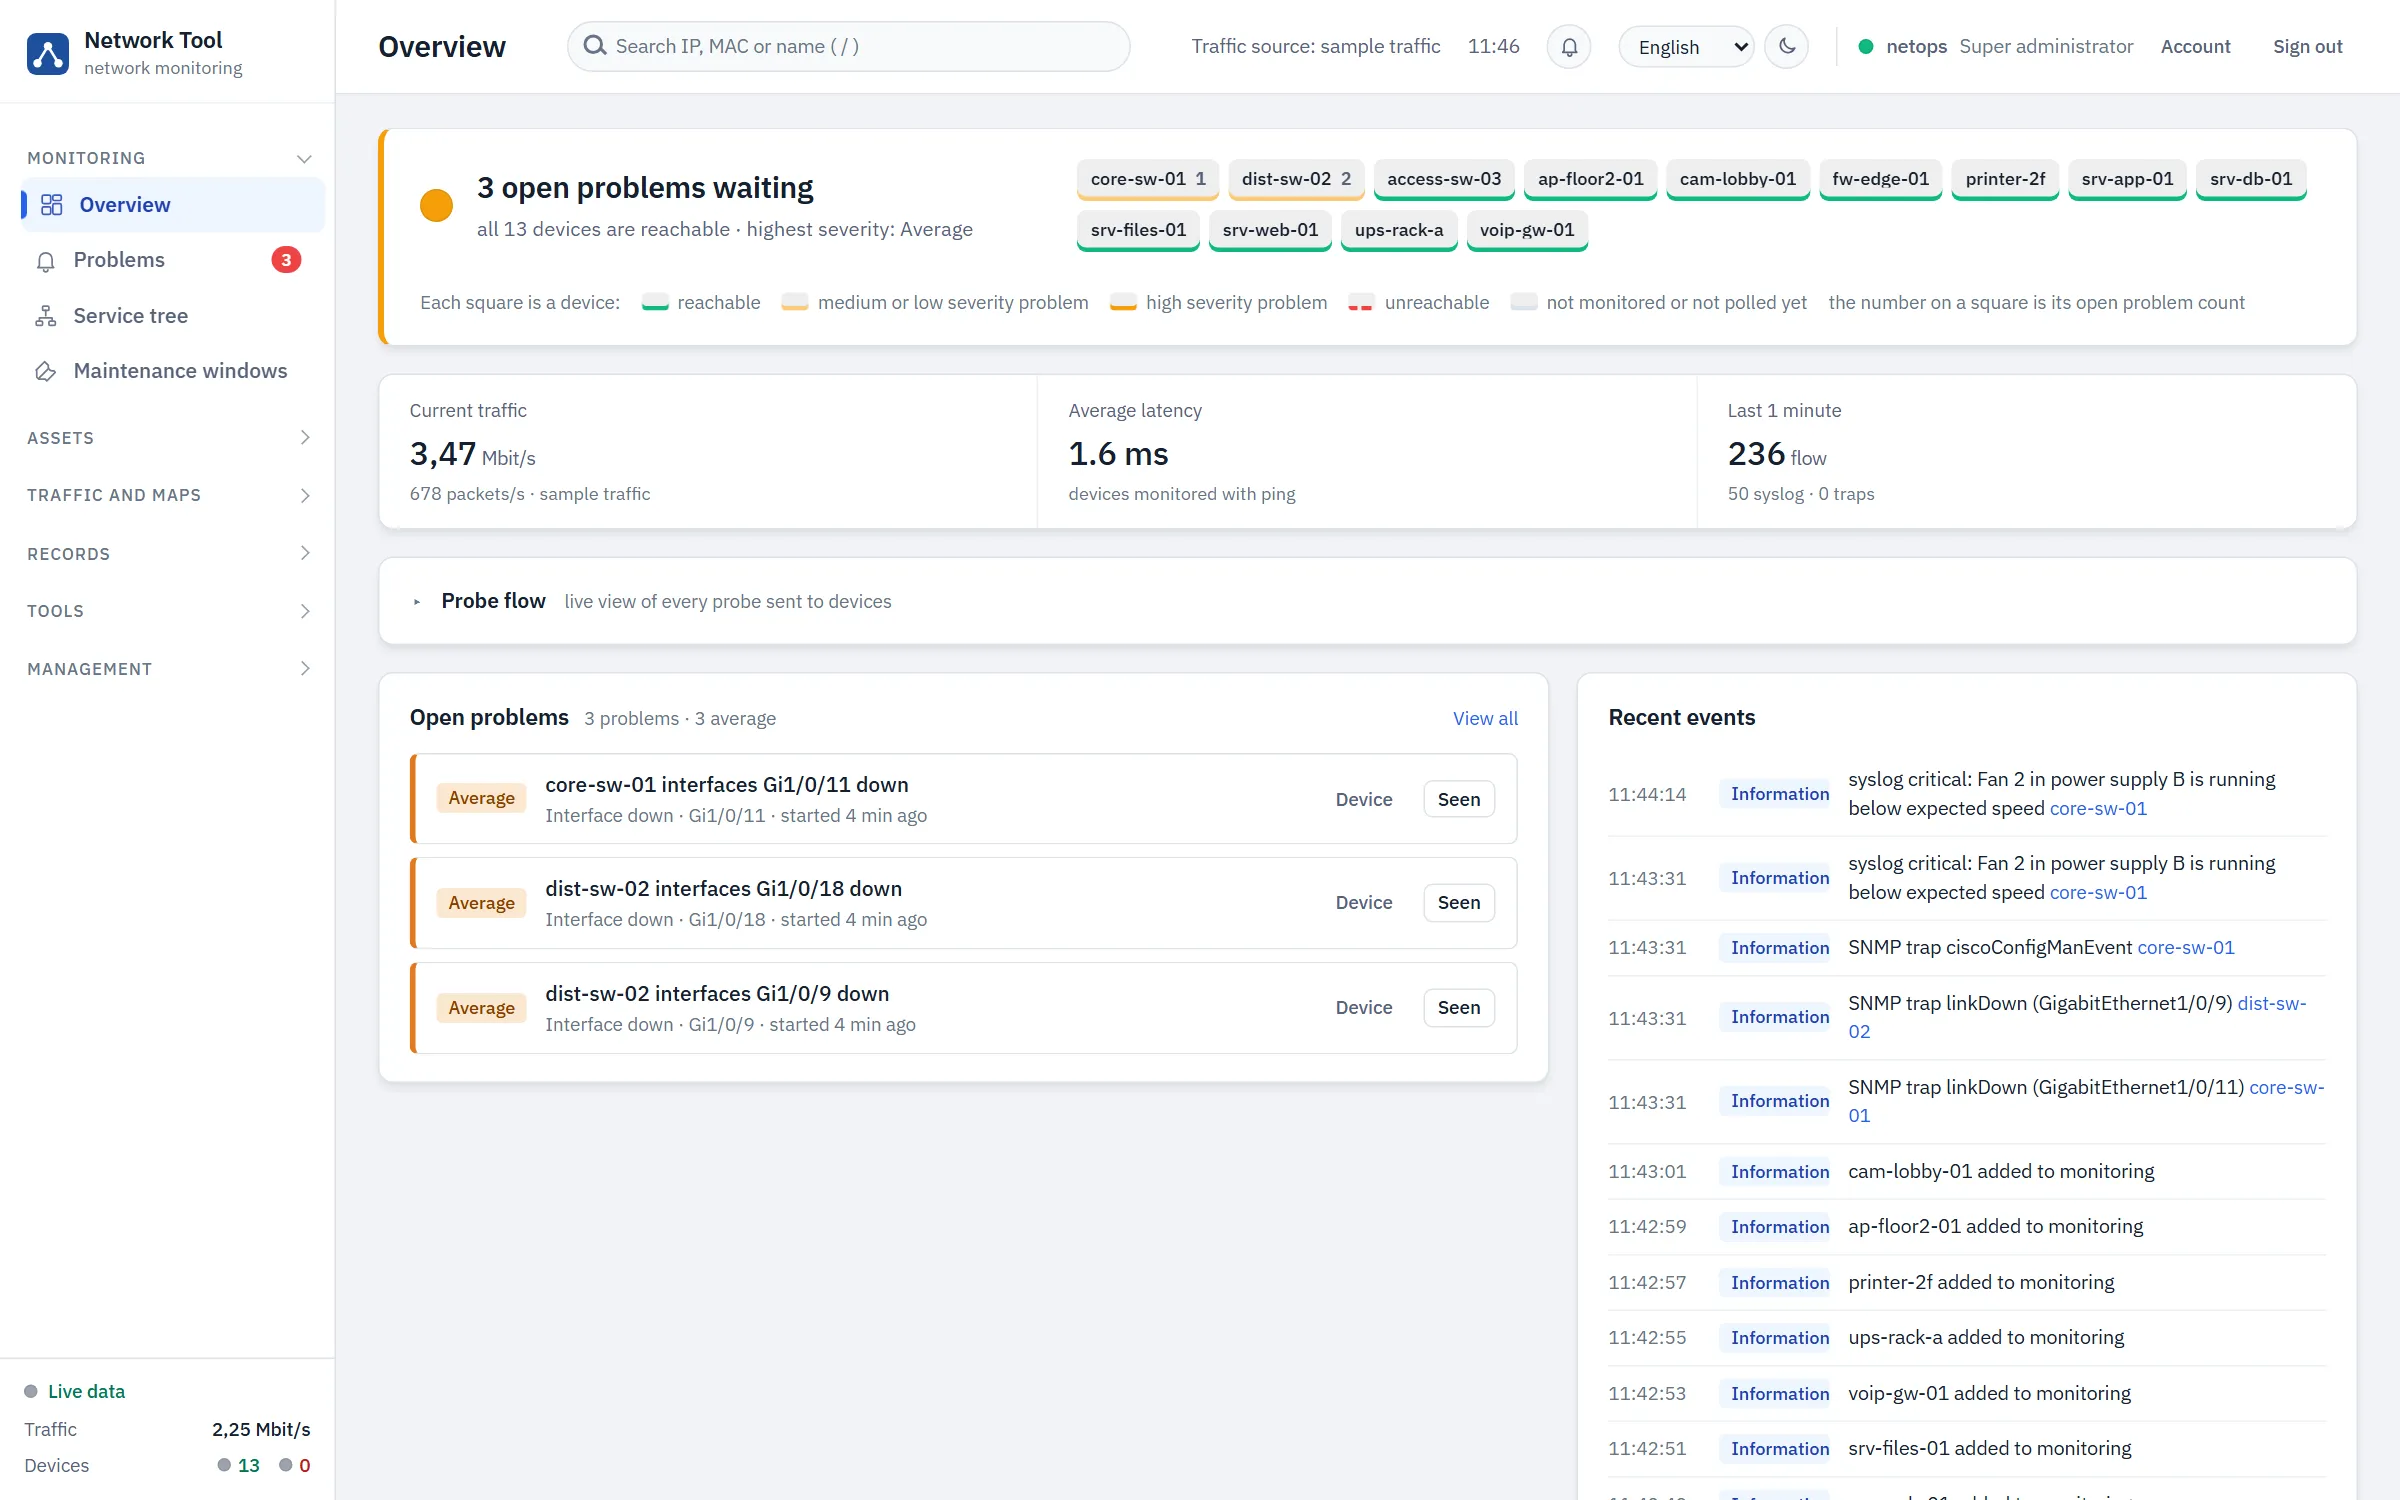
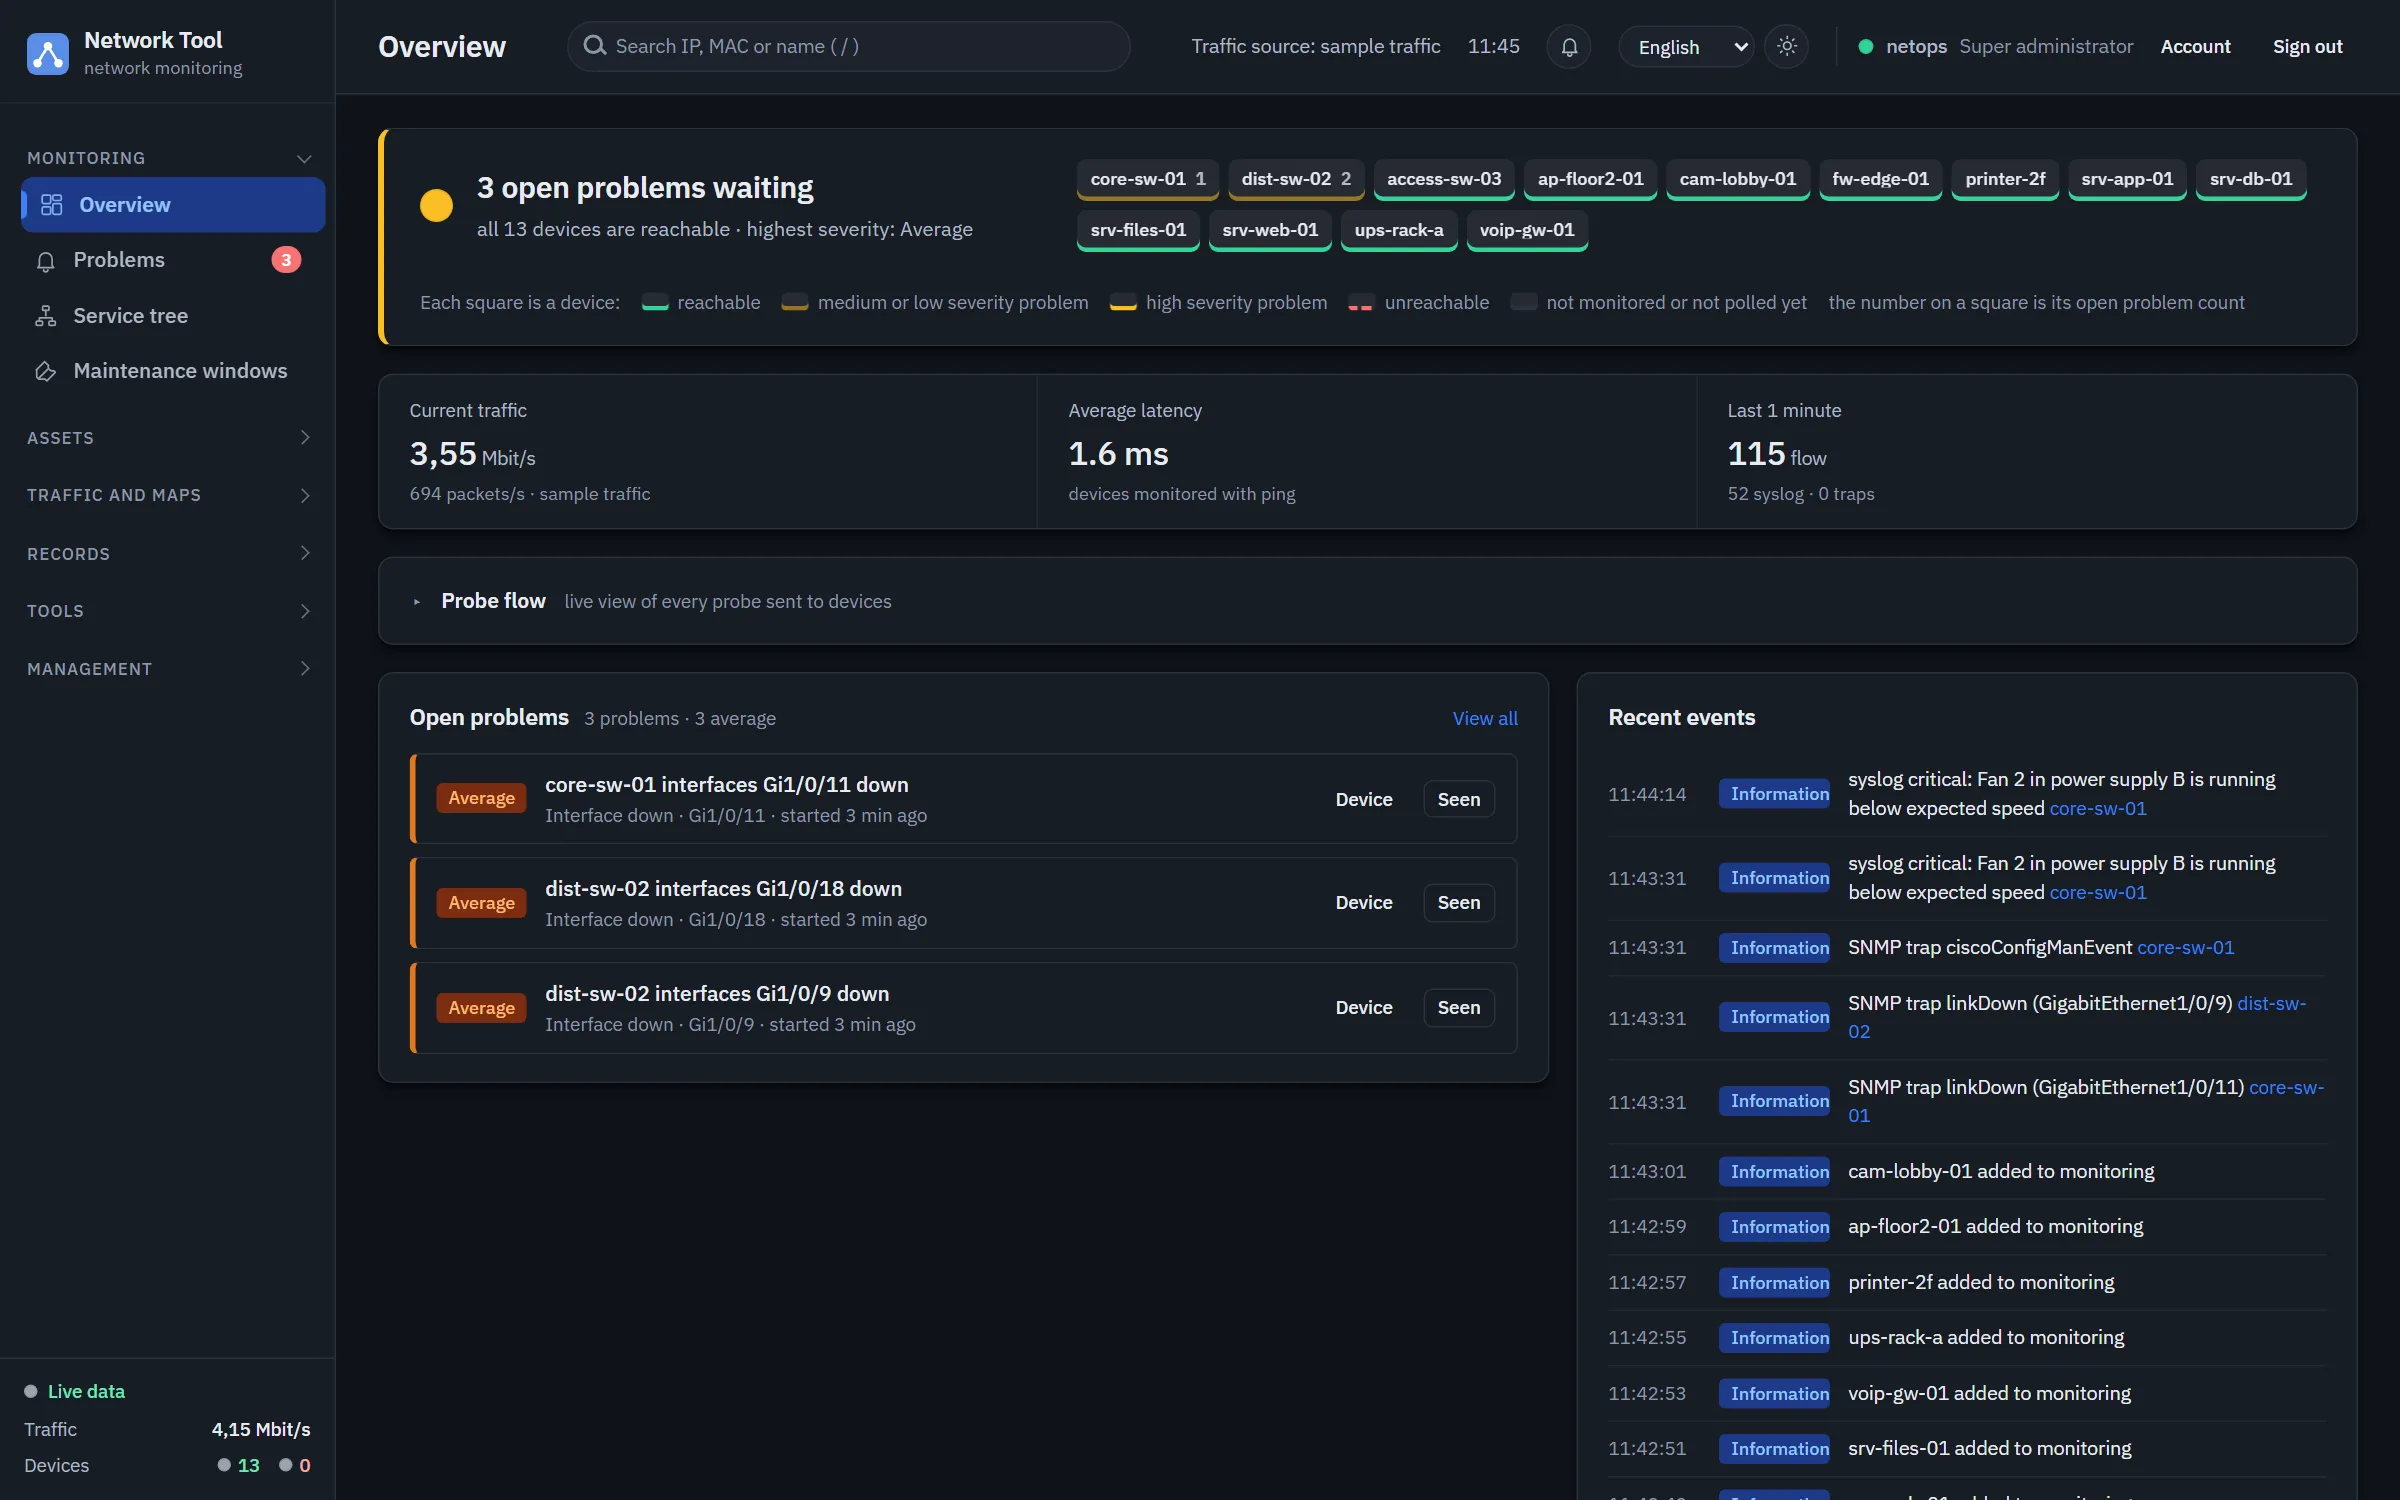
Overview: current traffic 3.55 Mbit/s, average latency 1.6 ms, and the open problems list with three interface-down rows.Overview: current traffic 3.55 Mbit/s, average latency 1.6 ms, and the open problems list with three interface-down rows.

3 open problems, all 13 devices reachable.

Speaks what your devices speak.

Out of the box it covers Cisco IOS, Cisco NX-OS, Cisco WLC, Meraki, MikroTik, Juniper Junos, Huawei, Aruba, UniFi, FortiGate, Cisco ASA / FTD, pfSense, Linux, Windows, VMware vSphere, Proxmox VE, Synology, APC and Kubernetes. It talks to them over SNMP v1, v2c and v3, NetFlow v5 and v9, IPFIX, sFlow v5, syslog, SNMP traps, LLDP and CDP, and SSH.

Root cause on top, the rest beneath it.

  • Interface GigabitEthernet1/0/11 changed state to down on the core switch, 10.20.1.1.

    The device itself is reachable; the syslog line and the linkDown trap are on the same page.

  • Floor 2 switch, 10.20.1.3. Three missed answers in a row marked it down; it is the root cause.

    3 dependent devices: printer-2f, ap-floor2-01 and cam-lobby-01 are suppressed. One message was sent, not four.

  • 10.20.20.21, behind access-sw-03. Unreachable because its switch is down.

    Listed, not alerted: the root cause is access-sw-03, so no message went out for the printer.

  • 10.20.20.31, the floor 2 access point, behind access-sw-03.

    Suppressed with root cause access-sw-03. It will clear on its own when the switch answers again.

  • 10.20.20.41, the lobby camera, behind access-sw-03.

    Suppressed with root cause access-sw-03. No mail, no WhatsApp; it counts as one of the 3 dependent devices.

  • Interface GigabitEthernet1/0/9 down on the distribution switch, 10.20.1.2.

    Average severity: the switch answers, one of its ports does not. The rule for core problems does not fire.

  • Interface GigabitEthernet1/0/18 down on the same distribution switch.

    Two ports on one switch stay two problems; the device is not down, so nothing behind it is suppressed.

  • A critical syslog line from 10.20.1.1: “Fan 2 in power supply B is running below expected speed”.

    Critical lines become events, and the alert rule “Core network down” sends them by e-mail and WhatsApp.

One screen tells you where to look.

This is the overview a team keeps open all day. Scroll, and it explains itself one part at a time.

The Network Tool overview: open problems, one square per device, traffic, open problems list and recent events.The Network Tool overview: open problems, one square per device, traffic, open problems list and recent events.
  1. The state in one sentence.

    How many problems are open, how severe the worst one is, and how many devices answer.

  2. One square per device.

    Its colour is its state and the number on it its open problems. A red square has stopped answering.

  3. Traffic, latency, the last minute.

    Bandwidth right now, average ping latency, and the flow records, syslog lines and traps of the last minute.

  4. Open problems.

    Each with its severity, the device and port, and when it started.

  5. Seen does not close it.

    It marks a problem as acknowledged. The problem closes when the cause is gone.

  6. Recent events, as they arrive.

    Critical syslog lines, SNMP traps and changes, each linked to its device.

  7. Search everything.

    An IP, a MAC address or a name, from any page. The / key jumps here.

Know the moment something stops.

Network Tool pings every device every 15 seconds. Three missed answers in a row and the device is marked down, and you get a message.

Technical details
  • ICMP ping with min/avg/max round-trip time and packet loss. TCP service checks with response time.
  • SNMP v1, v2c and v3: interface table with 64-bit counters, speed, admin/oper status, errors and discards; CPU and memory.
  • Ready-made SNMP templates for Cisco IOS, Linux, Windows, MikroTik, printers, UPS and PDU units, environment sensors, wireless controllers and access points, VMware ESXi and Synology. The template is picked from the device’s sysObjectID.
  • Switch port panel: one LED per port, rates, errors, VLAN, and the MAC addresses learnt on it mapped to IP addresses.
  • vSphere and Proxmox VE: hosts, virtual machines and datastore usage.
  • Website and certificate checks: status code, expected text, response time, days until the TLS certificate expires.
  • Maintenance windows: planned work does not raise alerts or count against availability.
Port panel of a 28-port Cisco switch: green ports are connected, grey ports are empty, one port shows a rising error counter in red.Port panel of a 28-port Cisco switch: green ports are connected, grey ports are empty, one port shows a rising error counter in red.

See who is using the bandwidth.

Watch the traffic on your network as it happens: which machine is talking to which, over what, and how much.

Technical details
  • Live packet capture (libpcap): top talkers, conversations, protocols, ports.
  • NetFlow v5 / v9 / IPFIX on udp/2055 and sFlow v5 on udp/6343: exporters, top talkers, recent flows.
  • HTTP inspector for plain HTTP/1.x: method, URL, headers, body, status and duration. Encrypted HTTPS content cannot be read.
  • 3D network map in three tiers (Internet, network devices, local network), with link thickness by traffic and cables taken from LLDP/CDP neighbour tables.
  • Software map: which machine runs which service on which port, recognised from a catalogue of about sixty technologies (PostgreSQL, Redis, Kafka, Nginx and others).
  • Anomaly alerts: each address and interface learns its usual traffic for every hour of the week and raises a problem when it goes far above it.
3D network map: the Internet at the top, switches and the firewall in the middle, servers, office devices and Kubernetes nodes in subnet boxes at the bottom, with moving dots showing traffic.3D network map: the Internet at the top, switches and the firewall in the middle, servers, office devices and Kubernetes nodes in subnet boxes at the bottom, with moving dots showing traffic.

Every device’s logs in one place.

Your devices already write down what goes wrong. Network Tool collects those lines, keeps them for 90 days and lets you search them next to everything else.

Technical details
  • Syslog receiver on udp/514: RFC 3164, RFC 5424 and Cisco IOS formats. Critical lines become events.
  • SNMP trap and inform receiver on udp/162 (v1, v2c).
  • Firewall log analysis for FortiGate, Cisco ASA/FTD, pfSense, iptables/nftables and MikroTik: allowed and denied traffic per rule, most-denied sources and ports, port-scan detection.
  • Stored in PostgreSQL. Default retention: syslog, traps and firewall events 90 days, NetFlow records 7 days. Each can be changed.
  • Metrics: 5-minute summaries kept 30 days, hourly summaries kept 400 days. Charts read the archive without extra steps.
  • Every page has a History card with a time range, filters and CSV export.
Syslog lines from the core switch: interface down errors, configuration changes and SSH logins, with severity and the Cisco message code.Syslog lines from the core switch: interface down errors, configuration changes and SSH logins, with severity and the Cisco message code.

One message instead of two hundred.

When the core switch goes down, everything behind it stops answering too. Network Tool works out which device is the real cause and sends one message about it, saying how many devices it affects.

Technical details
  • Severity levels and triggers for host down, packet loss, latency, interface down or full, CPU, memory, closed port, expiring certificate and more.
  • Parent devices: when a parent is down, problems on the devices behind it are listed as suppressed and do not send mail.
  • Delivery by e-mail (built-in SMTP client), WhatsApp (Meta WhatsApp Cloud API) and webhooks for Slack, Microsoft Teams or a ticketing system.
  • Rules by problem type, device or group, minimum severity, wait time before the first message, repeat interval and a “resolved” notice.
  • Automatic actions: run a script on the server or a command on the device over SSH when a problem opens.
  • Scheduled reports by day, week or month, with a CSV attached and an SLA target.
  • Capacity forecast: from the last seven days’ trend, a disk or memory pool that will be full within 30 days becomes a problem.
  1. access-sw-03 stops answering.

    Three pings in a row go unanswered. After 45 seconds the floor 2 switch is marked down and a High problem opens.

  2. The devices behind it are suppressed.

    The printer, the access point and the camera on floor 2 stop answering too. Network Tool knows their parent is down and lists them as suppressed.

  3. One message goes out.

    The rule “Core network down” sends one e-mail and one WhatsApp message about access-sw-03, saying that 3 devices depend on it. Nothing is sent for the other three.

Open problems1 needs attention4 needs attention · 3 suppressed
Highaccess-sw-03 is not answering ICMP (7 consecutive failed checks)Device unreachable · started 1 min ago · 3 dependent devices
Suppressedprinter-2f is not answering ICMP (7 consecutive failed checks)Device unreachable · started 1 min ago · root cause: access-sw-03
Suppressedap-floor2-01 is not answering ICMP (7 consecutive failed checks)Device unreachable · started 1 min ago · root cause: access-sw-03
Suppressedcam-lobby-01 is not answering ICMP (7 consecutive failed checks)Device unreachable · started 1 min ago · root cause: access-sw-03
Sent: e-mail and WhatsApprule “Core network down” · access-sw-03 · 3 dependent devicesnothing sent for the 3 suppressed devices

From “who is this IP?” to the fix.

Type an address into the search box. You get the device, the switch port it is plugged into, its problems and its recent history. Run a traceroute or open a terminal on the same screen.

Technical details
  • Global search (shortcut /) by IP, MAC address or name across devices, newly seen devices, ARP, live traffic, logs and HTTP requests.
  • Machine 360: one page per address with identity, switch port and MAC, open problems and a single timeline built from eight sources.
  • Diagnostics: ping with a loss and latency chart, traceroute with reverse DNS, DNS lookup and port checks.
  • Web terminal over SSH in the browser, for administrators only, recorded in the audit log.
  • Configuration backups for Cisco IOS/NX-OS, MikroTik, Junos, Huawei and Linux: nightly and on demand, with a line-by-line diff and an alert when the config changes.
  • Compliance rules such as “telnet must be off”: a violation becomes a problem.
  • Network discovery: ARP table and subnet sweep, new devices waiting for approval, and a diff between two scans.
  • IP address management with subnet usage and DHCP scopes, and a hardware inventory with serial numbers and warranty dates.
Machine 360 page for core-sw-01 at 10.20.1.1: one open interface problem, its MAC address, the detected type “Switch, Cisco”, and a timeline of recent syslog lines and traps.Machine 360 page for core-sw-01 at 10.20.1.1: one open interface problem, its MAC address, the detected type “Switch, Cisco”, and a timeline of recent syslog lines and traps.

Your server, your data, your rules.

Network Tool runs on your own server. Your network data stays inside your company. You decide who can see and change each part, and every change is written down.

Technical details
  • One Java application plus PostgreSQL. A Docker Compose file starts both. A systemd unit is included.
  • Roles with None, View or Manage rights for each of 28 areas of the app.
  • Passwords hashed with Argon2id. Second login step per user: e-mail code or an authenticator app (TOTP). LDAP / Active Directory sign-in.
  • Audit log of every change and sign-in with before and after values, protected by a SHA-256 hash chain with an integrity check. Kept 365 days by default.
  • Your company name and logo on the screens, the login page and every e-mail.
  • Six interface languages (English, Turkish, French, Italian, Afrikaans and Simplified Chinese), light and dark theme, and a layout that works on a phone.
  • High availability with two servers: the standby takes over 30 seconds after the active one goes silent. Remote probes watch branch offices and report to the centre.
  • REST API and a live WebSocket feed.
Audit log: sign-ins and configuration changes with who, when, from where and the result.Audit log: sign-ins and configuration changes with who, when, from where and the result.

Three steps to your first alert.

  1. Install it on one Linux server.

    Start the app and its database with Docker Compose, or run the Java file with PostgreSQL you already have.

    bash
    docker compose -f docker/docker-compose.yml up -d
  2. Point your devices at it.

    Add the server as the SNMP, syslog and NetFlow destination on your routers and switches. On a Cisco device that is five lines:

    Cisco IOS
    snmp-server community public RO
    snmp-server host <server> version 2c public
    logging host <server>
    ip flow-export version 9
    ip flow-export destination <server> 2055
  3. Watch, get alerted, fix.

    Devices appear on the overview as they answer. Add an alert rule, and the next problem reaches your phone.

    Network ToolWhatsApp · 11:34

    High · access-sw-03 is not answering ICMP (7 consecutive failed checks)

    Device unreachable · 10.20.1.3 · 3 dependent devices

    Rule: Core network down · repeats every 30 min until resolved

Built for the people who audit it.

  • Self-hosted

    Runs on your server. Network data does not leave your company.

    Java 21 + PostgreSQL, Docker or systemd

  • Roles and two-step login

    Each person gets exactly the access they need.

    28 areas × None / View / Manage · TOTP or e-mail code · LDAP

  • Tamper-evident audit log

    Every change shows who made it, when, and what it was before.

    SHA-256 hash chain with integrity check

  • Your brand

    Your company name and logo on every screen and e-mail.

    Name, subtitle, logo (SVG, PNG, WebP)

Users and roles: the super administrator role locked, and the ready-made Administrator and Viewer roles with their type.Users and roles: the super administrator role locked, and the ready-made Administrator and Viewer roles with their type.

Why one application.

Most networks are watched by a handful of separate tools. One pings devices, one collects flows, one stores logs, and the config backups live in a script.

Network Tool does those jobs in one install, behind one login, with one search box across all of it.

That means one server to patch and one tool for new staff to learn. When something breaks, the answer is on one screen.

JobWith separate toolsWith Network Tool
Is every device up?Monitoring serverDevices, Problems
Who used the bandwidth?Flow collectorLive traffic, NetFlow flows
What did the device log?Syslog serverSyslog, SNMP traps, Firewall
What changed in the config?Backup scriptConfig backups, with diff
Log in to the deviceSSH client on a laptopWeb terminal, audited
Tell the right personAlert setup in each toolOne set of rules: e-mail, WhatsApp, webhooks

It also watches your Kubernetes nodes.

A small agent on each node sends CPU, memory, disk, network and TCP health to Network Tool over one outgoing connection. Nothing is ever sent to the node.

How the Kubernetes agent works
Agent machines page: three Kubernetes nodes, one master and two workers, all online, with CPU, memory, network and TCP columns.Agent machines page: three Kubernetes nodes, one master and two workers, all online, with CPU, memory, network and TCP columns.

Licensed for your network.

Installed on your server and licensed per company. Tell us how many devices and sites you have, and we send a quote.

See it on a network like yours.

We will show you Network Tool live and answer questions about your setup.

Book a live demo