Watch your Kubernetes nodes without touching them.
A 1.3 MB agent on each node opens one outgoing connection and sends hardware and network health every few seconds. 29 built-in rules raise problems in Network Tool.
How the data flows.
Built to stay out of the way.
One socket, one direction
The agent connects to the collector once and keeps the connection open. The collector never writes back.
Few messages
Samples are batched and sent in one frame every 15 seconds; a typical batch is 1 to 2 KB.
Backpressure
When the collector is busy the agent queues locally, drops the oldest records if it must, and reports how many it dropped.
Small footprint
A 1.3 MB static image, a few MB of memory, three threads and a CPU limit of 50 millicores.
What it collects.
Each record type has its own interval. Network speed is measured passively from connections the node already has; no test packets are sent.
| Record | What is in it |
|---|---|
| sys · 5 s | CPU (user, system, iowait, steal), load, memory and swap, PSI pressure, temperature, file descriptors, OOM kills, conntrack, kubelet health |
| net · 5 s | Per interface: up, carrier, speed, bits and packets per second, errors, drops, utilisation |
| tcp · 5 s | Socket states, TCP and UDP memory, queue bytes, ephemeral ports, retransmits, listen overflows, passive RTT and congestion window |
| ports · 5 s | The busiest local ports: connections, peers, queues, bytes in and out, RTT, retransmits, backlog |
| disk · 10 s | Per device: utilisation, read and write throughput, IOPS, await, in flight |
| mount · 60 s | Used space and inodes per mount point |
| host · 5 min | Kernel, OS, addresses, boot time and the network sysctls that matter |
| conns, http · off by default | Outgoing connection attempts with their result, and plain HTTP requests with status codes |
29 rules out of the box.
The collector evaluates them on every node, and each can be tuned in collector.toml.
CPU, iowait and steal · memory, swap and PSI · temperature · file descriptors · OOM kills · kubelet · disk busy, full and inodes · NIC errors, drops, saturation and link down · TCP retransmits, listen overflows, memory pressure · ephemeral ports · TIME_WAIT floods · conntrack · softnet drops · RTT · agent drops · a node that goes silent
The tightest resource, named.
For every node the collector works out which resource is closest to its limit: CPU, memory or I/O pressure, one disk, one network interface, or one port’s backlog. When it stays over its threshold, it becomes a problem, and the node shows it as a badge.
In Network Tool.
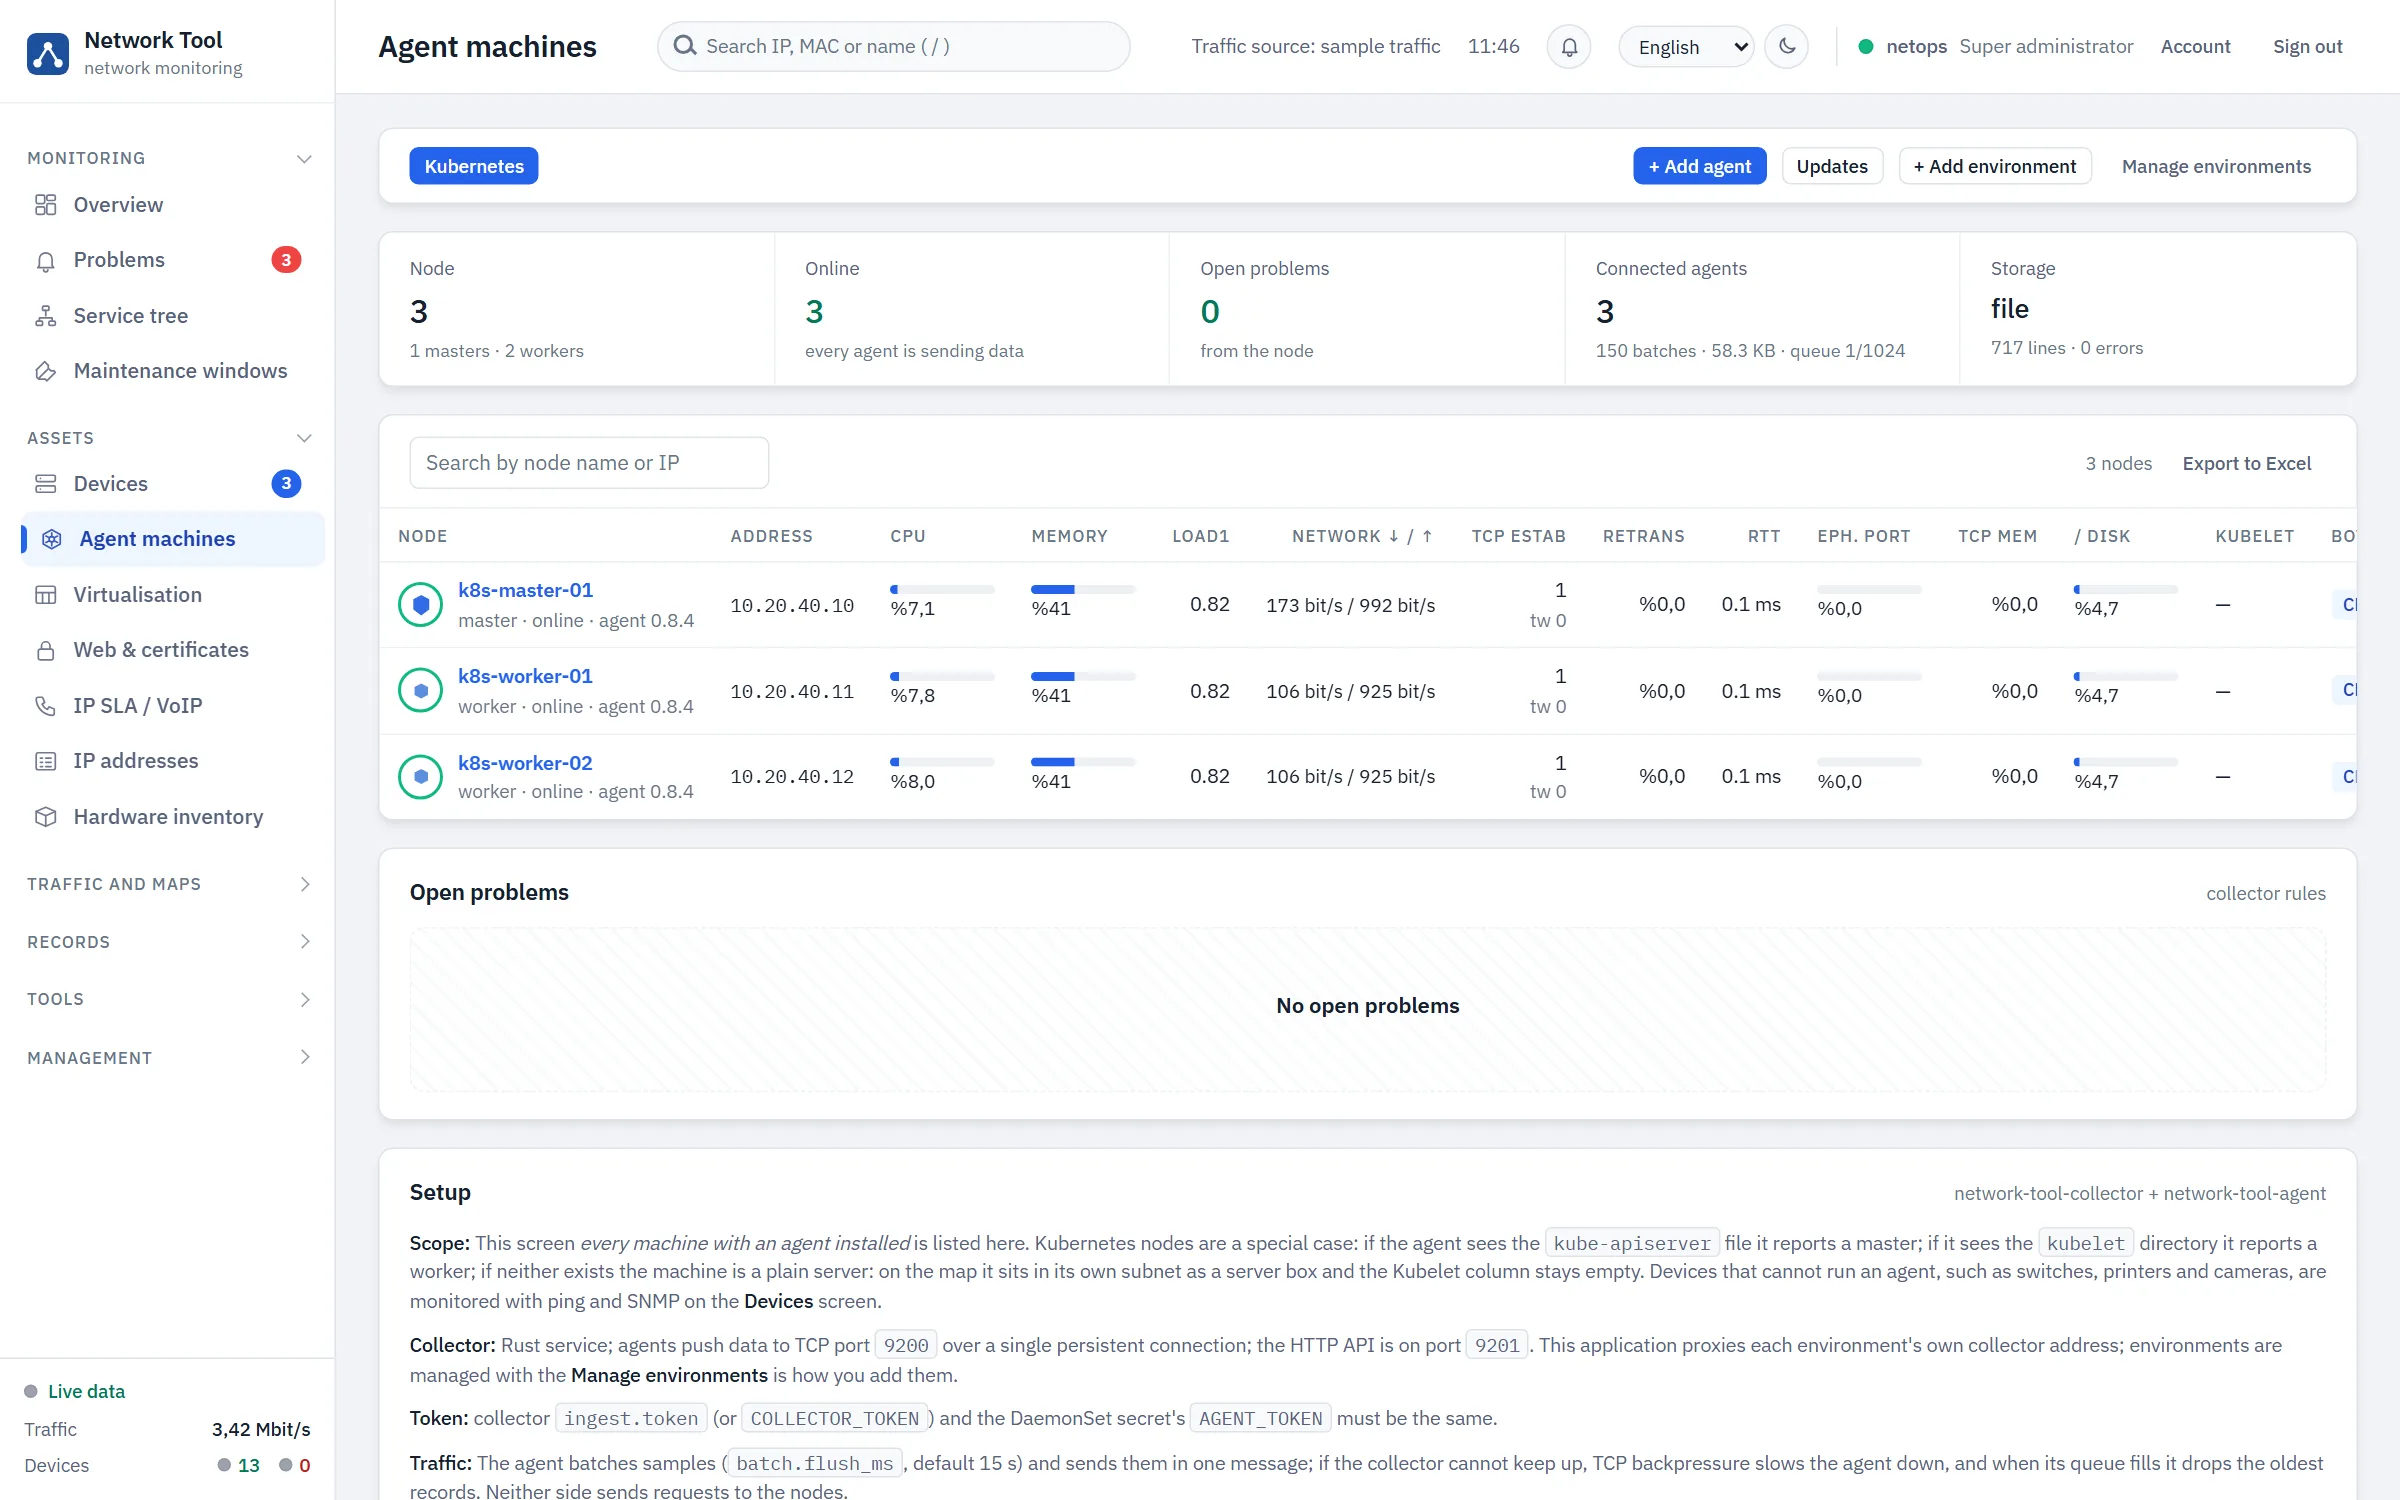
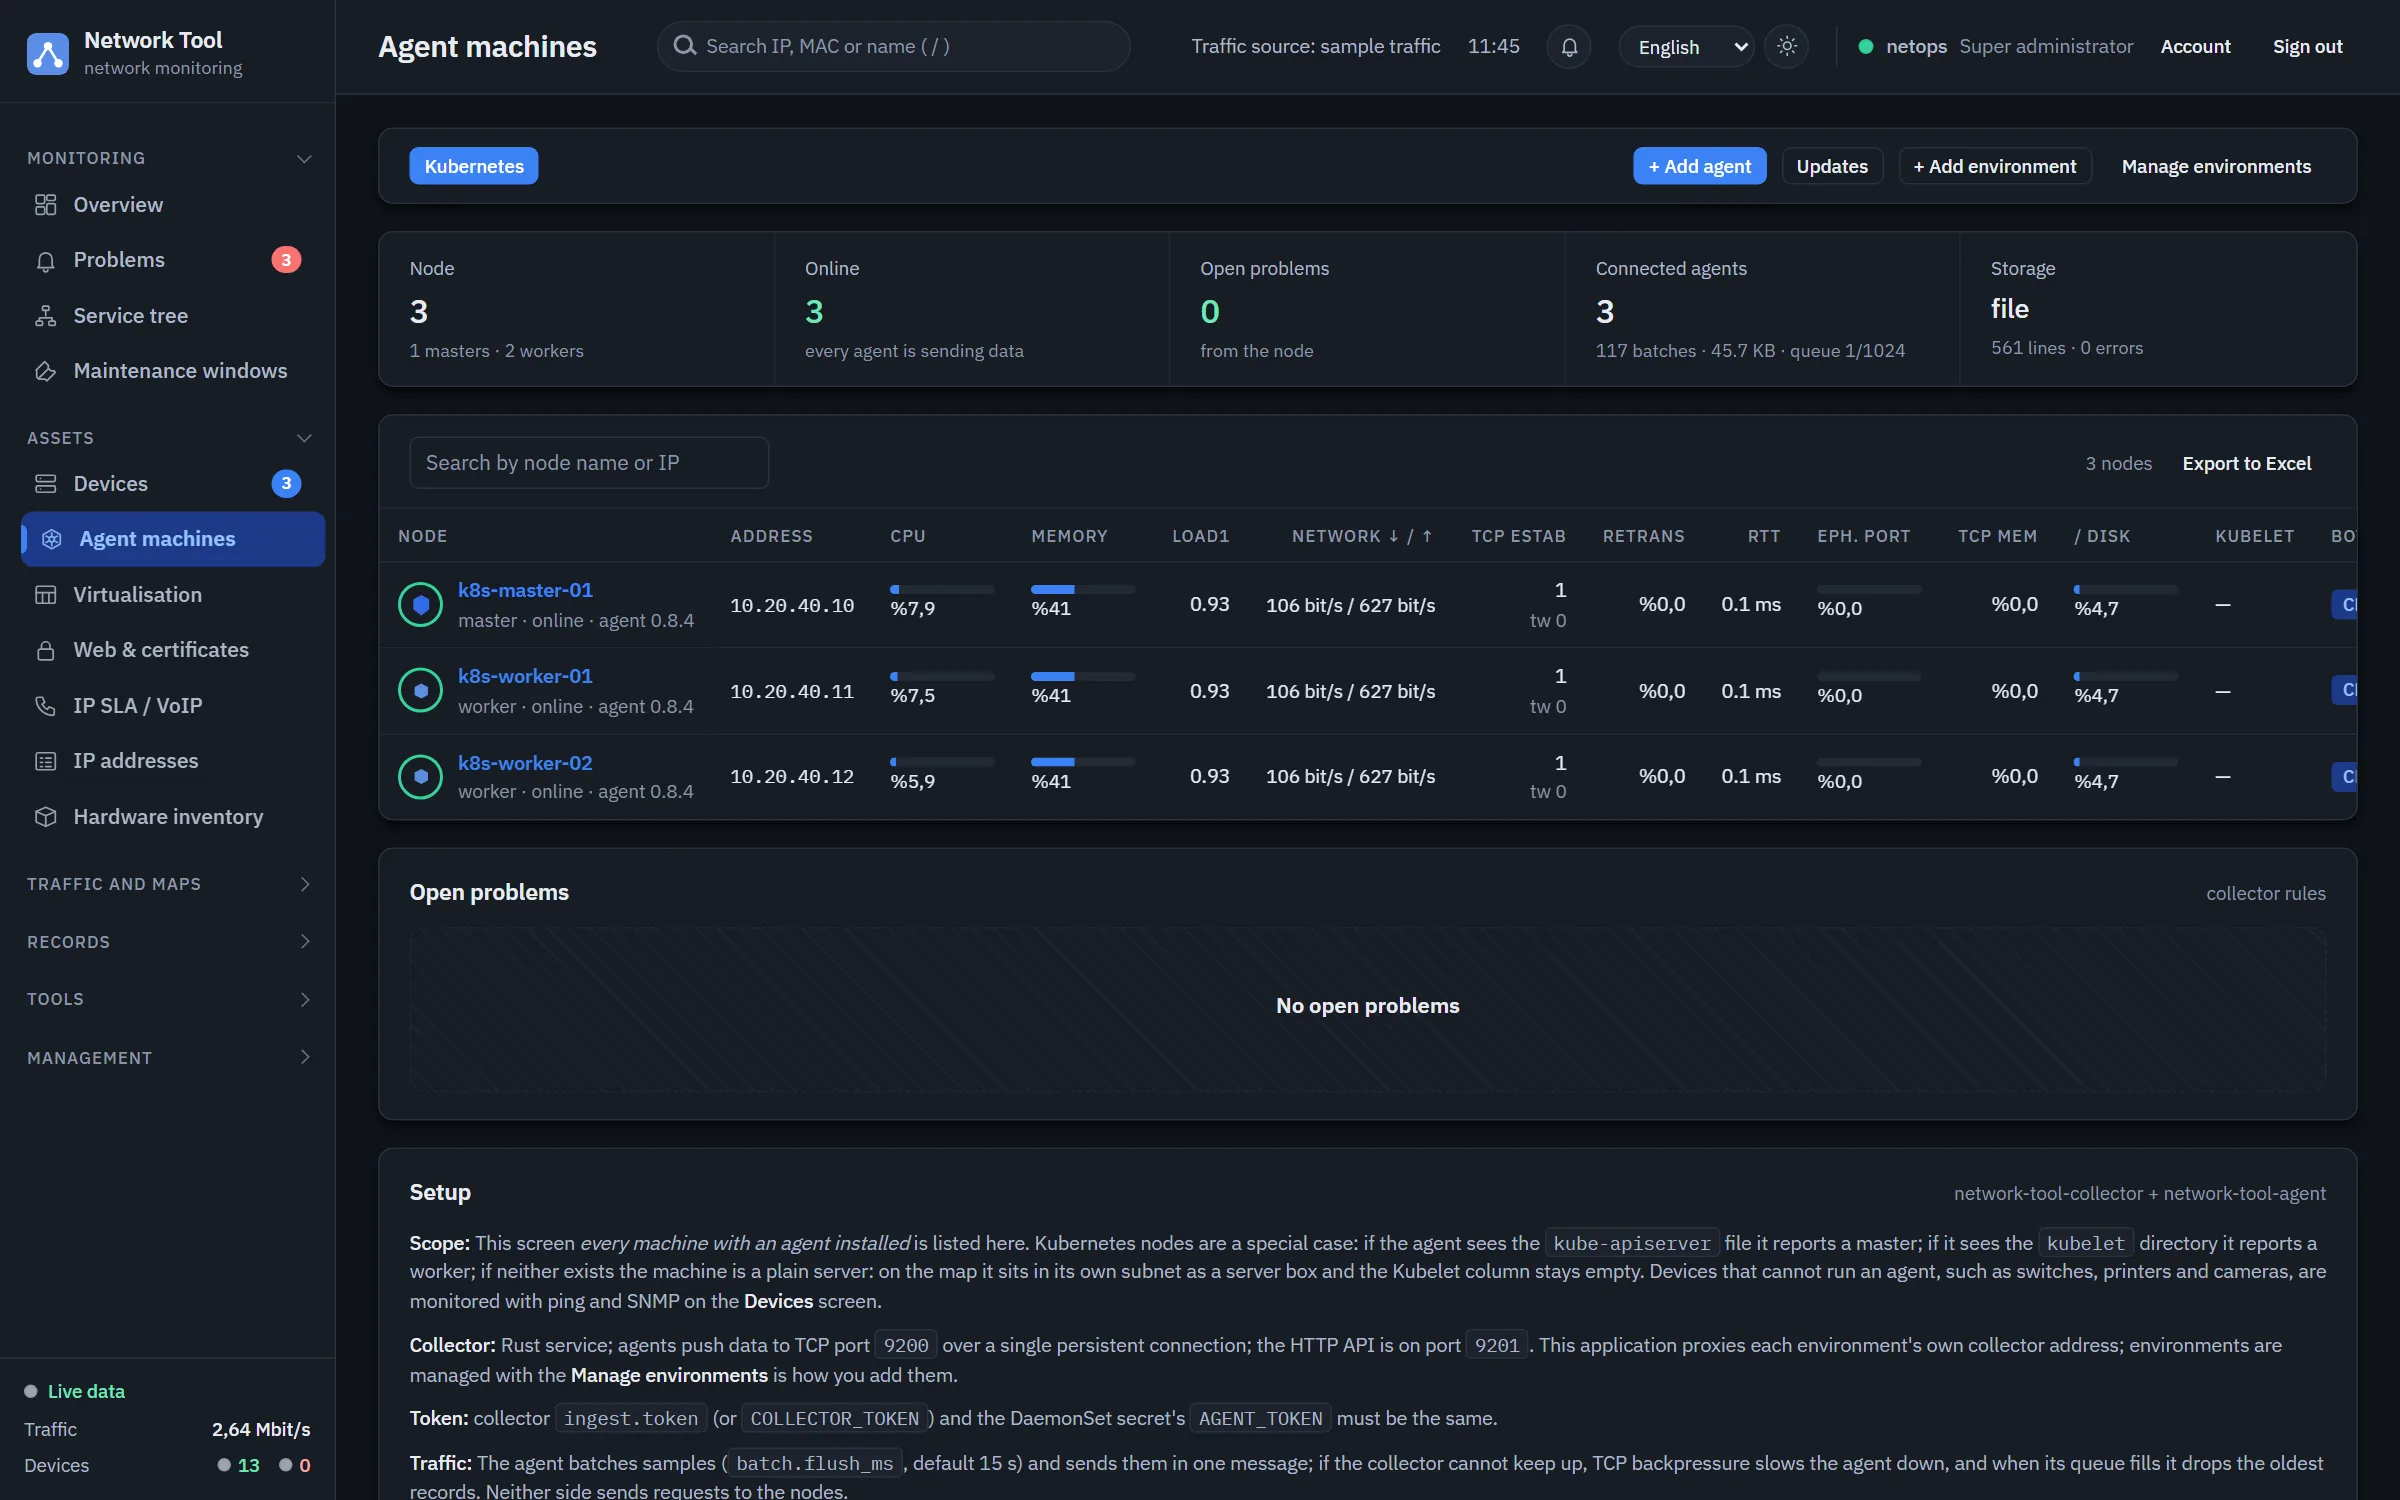
- A node list with CPU, memory, load, network, TCP and disk at a glance.
- A page per node with chart panels you can add, remove and reorder by dragging.
- Any chart turns into a table of the same series with one button.
- Pod and container names for addresses, and the DNS names workloads looked up.
- When a collector stops answering for 60 seconds, a problem opens and the last known nodes stay on screen.
- Several clusters side by side, each with its own collector.
Deploy it as a DaemonSet.
The manifest runs the agent on every node, including control-plane nodes.
kubectl apply -k k8s/
kubectl -n network-tool get ds,pods -o wide
Host network and host PID for the node’s socket table, the node root mounted read-only, a non-root user, every capability dropped, a read-only root filesystem, requests 5m / 16Mi and limits 50m / 64Mi, and no service-account token.
See it on a network like yours.
We will show you Network Tool live and answer questions about your setup.
Book a live demo